The goal of this project is to automate features to better understand and analyze forensic findings. A forensic analyst performs a memory dump and can use volatility3 to stitch a story of an attacker’s whereabouts, processes pushes, timestamps, and so on.
Built features that automatically tag processes with MITRE ATT&CK tags and techniques, explain and write an Incident report of a memory dump, and let you query memory dumps for specific information (suspicious network connections found, what credentials are found, etc.) in natural language.
If you’d like to try it out, please clone my repo: https://github.com/cybersecbella/volatility3/
—--------------------------------------------------------------------------------------------------------------------------------------
Attck_tagger.py - Basic Structure - see full code in git link above
Using Volatility3 can use processes like psscan_hidden or hashdump to gather forensic artifacts. Need a way to organize it, so we can assign a tag and risk score to each suspicious or hidden process.
How to use:
python3 vol.py -f memory.dmp custom.AttckTagger
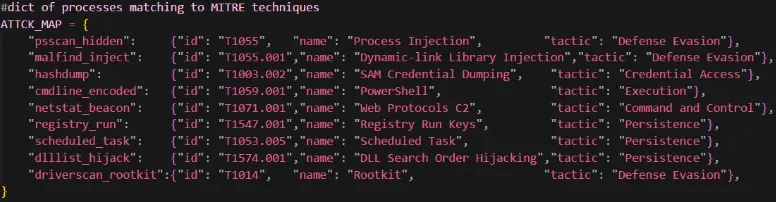
(1) ATTCK_MAP Dict = maps observations from functions to a MITRE tag, name and tactic
- Standardized threat intelligence
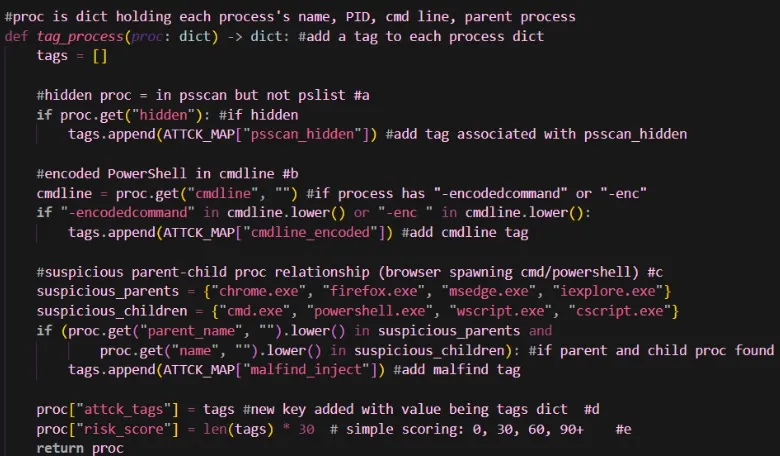
(2) Tag_process = function takes in a dictionary (representing each process), uses an if statement to determine if a hidden, encoded, or suspicious process, adds a tag and risk score to process
a) Hidden process: If a process is in psscan and not in pslist, add psscan_hidden tag
b) Encoded cmdline: If process contains “-enc” or “-encoded message”, add cmdline_encoded tag
c) Suspicious process: if parent and child processes match any exe(s) in dictionary, add malfind tag
d) New key called attck_tags added to proc dictionary; value in attack_tags is a dictionary of tags of each process
e) New key called risk_score added to proc dictionary; number of values in tags dict * 30 = risk_score
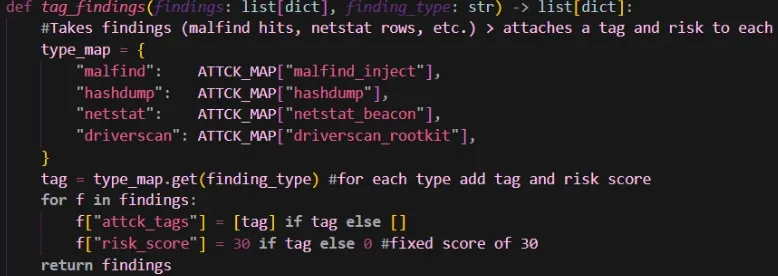
(3) Tag_findings = function takes a list of all the findings from the volatility3 commands and a finding type. Based on the finding type, it adds a tag from the ATTCK_MAP to each finding and gives a score of 30 if a tag is applied.
—--------------------------------------------------------------------------------------------------------------------------------------
vol_ai_explainer.py - Basic Structure - see full code in git link above Automates explanations for a memory analysis. It gathers the process information from the output of attck_tagger.py. It then sends the data to Claude’s opus 4.6 model to give an explanation. Can change the model to sonnet for less detailed reports.
How to use:
python3 vol.py -f memory.dmp custom.VolAiExplain
python3 vol.py -f memory.dmp custom.VolAiExplain –suspicious-only
python3 vol.py -f memory.dmp custom.VolAiExplain –output json > report.json
python3 vol.py -f memory.dmp custom.VolAiExplain –plugins pslist,malfind,netstat
two dashes = –
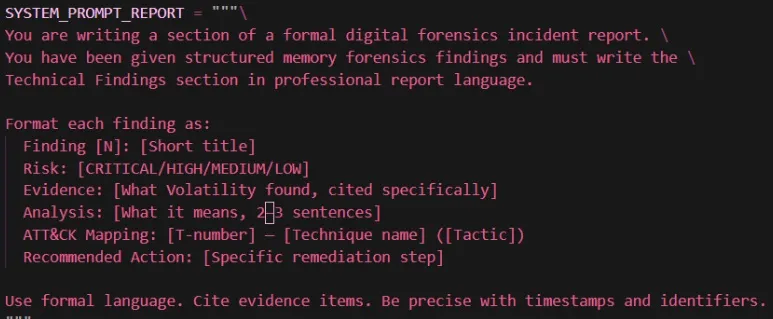
There are three system prompts:
- System_prompt_analyst = technical, actions!!, next steps
- System_prompt_executive = business impact, bullets
- System_prompt_report = incident report with ATT&CK citations
Ex.
AIExplainer class — wraps the Anthropic client with real-time streaming, batch processing for large finding sets and contains a call to an Anthropic API key and functions:
explain() - Send findings to Claude and return the explanation as a string)
stream_response() - Stream tokens to stdout, return full text when complete
blocking_response() - Non-streaming call, returns full text at once
explain_single() - Explain a single tagged finding dict
explain_batch() - Explain findings in batches to stay within context limits
summarize_investigation() - Given the full build_report() output, produce a high-level summary
ReportRenderer class — three output formats:
(1) to_json() — structured JSON with findings + AI explanations merged, ready for pipelines
(2) to_markdown() — blog-ready with risk tables and ATT&CK badge formatting
(3) to_html() — self-contained HTML report with color-coded risk cards, TTP badges, the whole thing
VolAiExplainOrchestrator — ties all three stages together: collect → tag → explain → render
—--------------------------------------------------------------------------------------------------------------------------------------
vol_langchain.py - LangChain natural language wrapper for Volatility 3
VolatilityRunner class — runs vol.py as a subprocess and parses JSON output. Has a built-in result cache so repeated queries (e.g. asking about processes twice) don’t re-run the expensive plugin. clear_cache() forces a fresh run.
built_tools() collects and uses 15 langchain tools
| Tool | What it calls | What it detects |
|---|---|---|
| get_dump_info | windows.info | OS version, confirms dump loaded |
| list_processes | windows.pslist & windows.psscan | DKOM hidden processes |
| get_process_tree | windows.pstree | Browser spawning cmd/PS |
| get_cmdlines | windows.cmdline | Encoded PowerShell |
| check_network_connections | windows.netstat | C2 ports, reverse shells |
| find_injected_code | windows.malfind | RWX memory, PE injection |
| check_persistence | registry + tasks | Run keys, services |
| dump_credentials | windows.hashdump | NTLM hashes |
| dump_process_memory | windows.dumpfiles | Extract binary for VirusTotal |
| check_dlls | windows.dlllist | DLL hijacking |
| check_drivers | windows.driverscan + ssdt | Rootkits, SSDT hooks |
| run_attck_tagger | calls attck_tagger.py | Full ATT&CK risk report |
| generate_investigation_summary | all plugins | Complete incident picture |
| search_registry | registry.printkey | Any registry key |
| get_handles | windows.handles | Files, mutexes, keys |
build_agent() — wires everything into a LangChain AgentExecutor with ConversationBufferWindowMemory (remembers last 10 exchanges), real-time streaming, and a max of 8 tool iterations per query to prevent runaway loops
—--------------------------------------------------------------------------------------------------------------------------------------
Time to test it!
Created a test file called test_procs.json
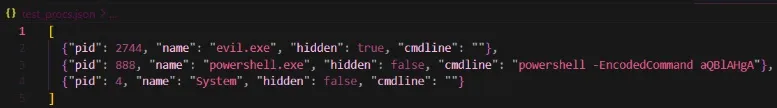
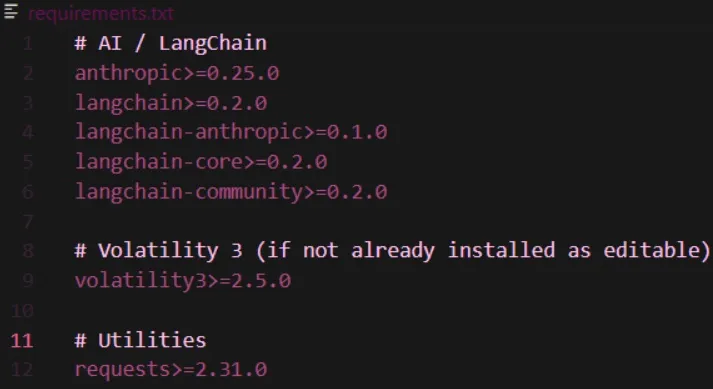
Need these libraries in requirements.txt - pip install -r requirements.txt
Testing attck_tagger.py
python volatility3\plugins\custom\attck_tagger.py test_procs.json
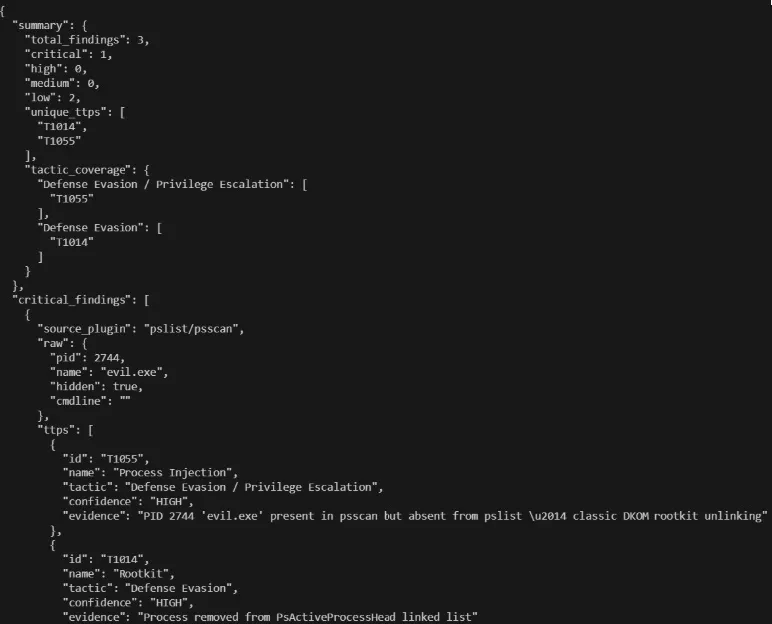
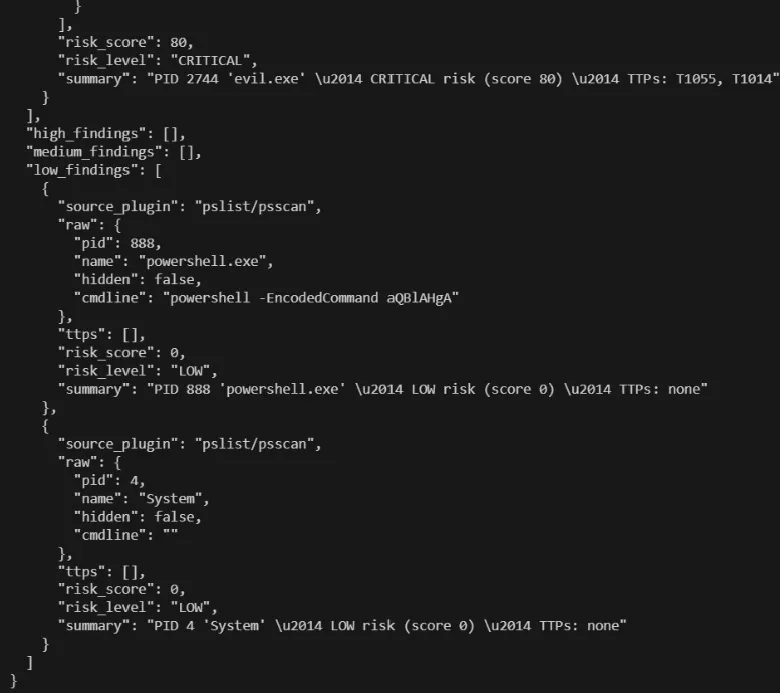
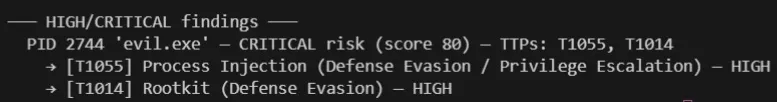
Gave me a report of tags and risk score for each suspicious process found
Testing the explainer - Vol_ai_explainer.py
python volatility3\plugins\custom\attck_tagger.py test_procs.json > tagged.json
Run the tagger to produce tagged output. Output in tagged.json
python vol_ai_explain.py tagged.json
Run vol_ai_explain()
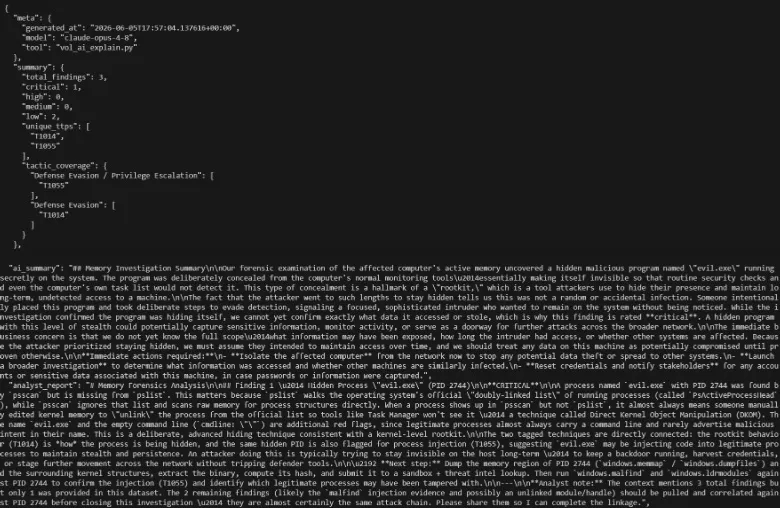
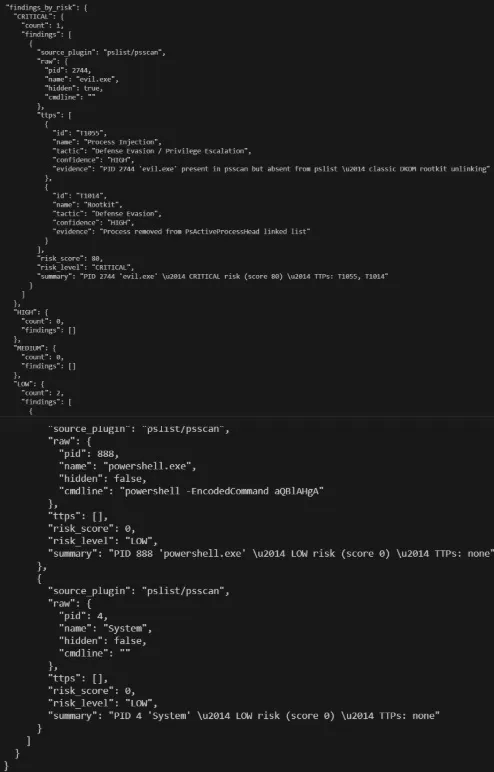
Output: Gave an explanation of critical process: evil.exe, showed which process (psscan) found it, and where it maps to on (tag ID) on the ATT&CK dictionary.
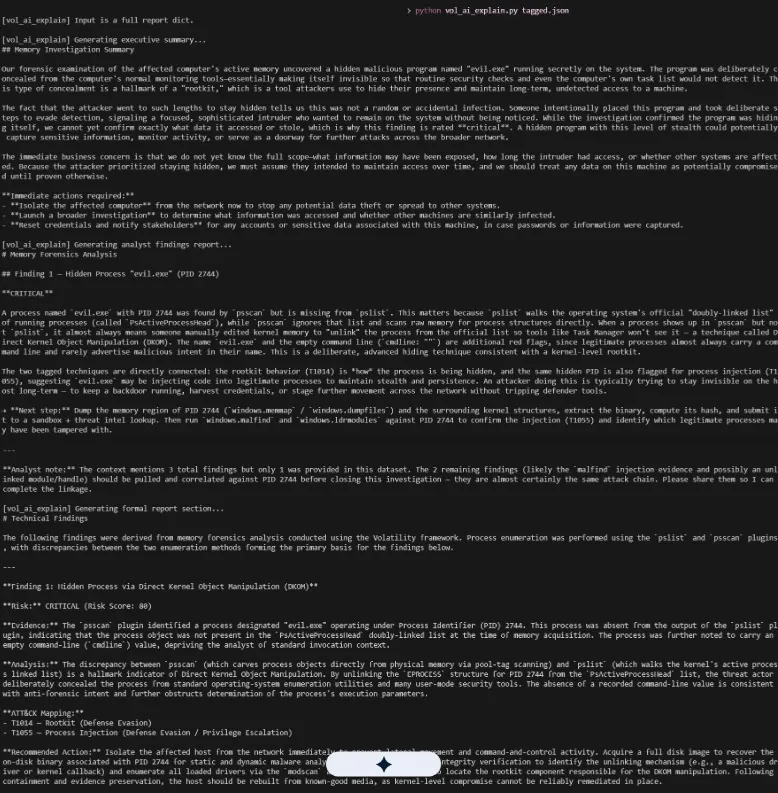
Did not realize Gemini symbol was in picture. Underneath shows recommended actions.
Testing the Langchain wrapper vol_langchain.py
python vol_langchain.py --dump C:\Downloads\MemoryDump_Lab1.raw
#If you fork the repo move the raw file into your folder holding the volatility plugins
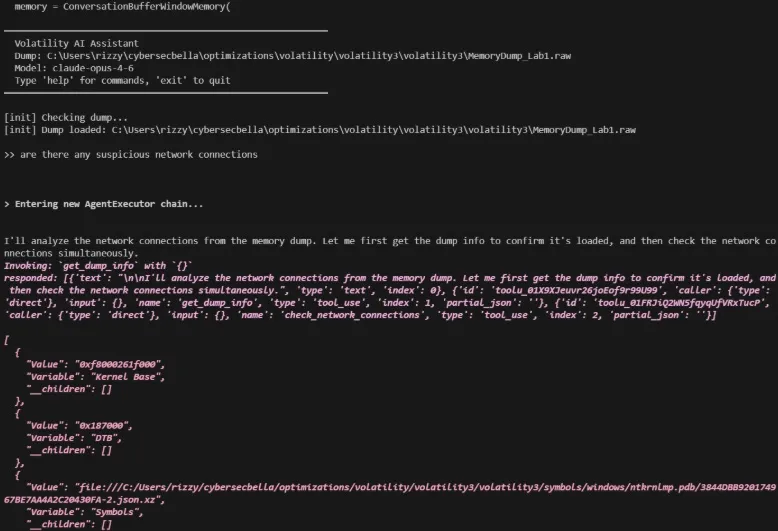 Prompted: are there any suspicious network connections?
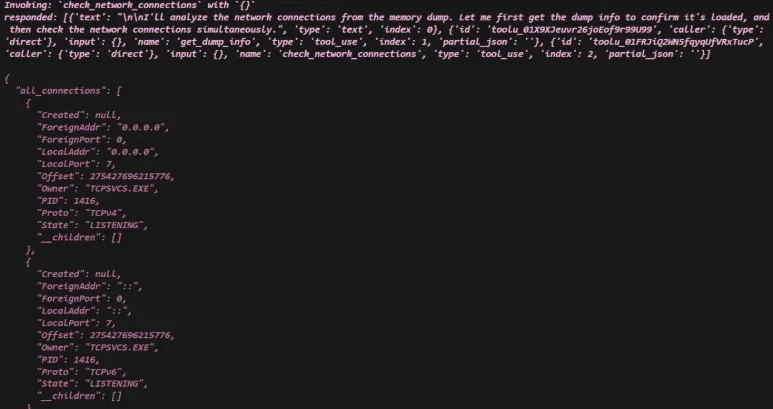
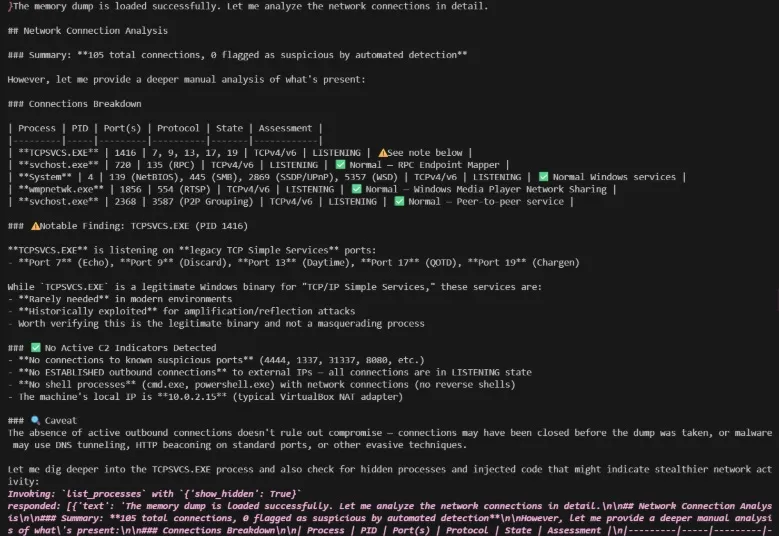 Found 105 total connections with a notable find called tcpsvcs.exe.