This article dives into how to analyze data on a compromised system — a malicious script called AtomicService was run on a Windows 10 VM acting as the target — and what to look for. The Forensic Process has four phases: Collection, Examination, Analysis, Reporting. This covers the Collection and Examination phases.
The Collection phase answers the question: What data are we working with? Memory on disk (when using a virtual machine).
Needed:
- Windows 10 Virtual Machine
- An attack script that has been run on the Windows 10 target machine
Tips:
- Do not shut down the virtual machine to acquire memory. Shutting it down loses memory and the current status of data. The solution is to take a snapshot or pause the VM instead.
- Create a Tools folder when downloading multiple tools to assess, extract, and process data.
- When collecting data, create an Evidence folder.
- When assessing data, create a Cases folder — store an Analysis folder with subfolders: EventLogs, Execution, Memory, NFTs, Registry.
dir /agives you additional hidden file information.
Terminology:
- Dirty File: A file that has not been written with the latest updates from the transaction logs.
- Fileless Attack: Info passed to the registry and executed as a malicious payload — no file is dropped to disk.
Memory Acquisition
Analyzing data requires having data to work with. The Collection phase includes Memory Acquisition — exporting the memory from your disk image. Using a tool called VBoxManage, the commands below should be typed on a command line on your host machine.
Make sure after VBoxManage is started to navigate to the Evidence folder where the
.raw,.vhd, and hash.txtfiles will be stored.
To start VBoxManage.exe, do one of the following:
- Navigate directly to:
C:\Program Files\Oracle\VirtualBox\VBoxManage.exe - Add it to your PATH from within the Evidence folder:
SET PATH=%PATH%; "C:\Program Files\Oracle\VirtualBox"
Then list all VMs:
vboxmanage list vms
Shows all virtual machines in VirtualBox. The number in {} at the end is the unique vm-uuid.
vboxmanage debugvm {vm-uuid} dumpvmcore --filename nameyourfile.raw
Produces a raw file stored in the Evidence folder, which will be used to generate a hash.
certUtil -hashfile nameyourfile.raw > nameyourhash.txt
Stores the SHA-1 hash of the raw file in a text file.
The last command is essential. It calculates the hash — this is what you share alongside the acquired data. A forensic analyst will verify that the hash shared matches the hash stored in the text file, ensuring the memory or data has not been modified.
Now that memory has been acquired, you can shut down the virtual machine.
The next step is to export the disk image and create a triage data collection. There are two ways:
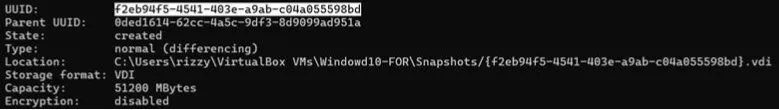
Option 1 — VirtualBox GUI: In VirtualBox, go to the Tools header → checklist icon → Media section → Hard Disks. Each disk has a VDI unique identifier. If you took a snapshot it will have an associated VDI. The last VDI shown (expand the dropdown) is the VDI for the current state. Right-click it and select:
- File type: VDI
- Storage: Dynamically allocated
Example:
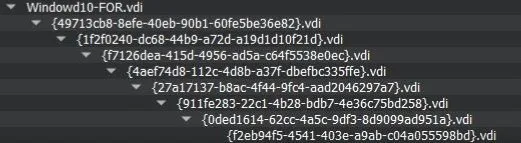
f2eb94f5… is the one you would use.
Option 2 — VBoxManage terminal (if you closed the terminal, repeat the PATH step above first):
vboxmanage list hdds
Shows VDI unique identifiers. The last one is the disk-uuid needed.
vboxmanage clonemedium disk {disk-uuid} --format VHD nameofdisk.vhd
Clones the disk image.
certUtil -hashfile nameofdisk.vhd > nameyourdiskhash.txt
Stores the SHA-1 hash of the VHD file in a text file. Both hashes are stored in the Evidence folder — memory acquisition is complete.
Now extract and assess the data. Start the VM and download the mounter. First, mount the disk image using Arsenal Image Mounter.
- Download: arsenalrecon.com/downloads
- Help Guide: Arsenal Image Mounter Walkthrough
Mounting steps: Unzip the downloaded file → Start ArsenalImageMounter.exe → Press OK (Free mode, no license needed) → Press Yes for any additional installations → Press Mount Disk Image and select the VHD file in your Evidence folder → Select:
- Disk Device write temporarily
- Store differencing data in host RAM only (not in a file)
- OK → Yes to following prompts
Disk Manager (search in Windows) should then show the same mounted folder(s) as in Arsenal Image Mounter.
Examination
Extracted data goes in a Cases folder. Drive E: is mounted via Arsenal Image Mounter.
Tools needed:
- KAPE — extracts forensic artifacts
- RegRipper — parses registry hives into readable output
- Zimmerman Tools — suite of tools for forensic analysts
KAPE extracts data and can merge transaction logs with registry hives to create a comprehensive report. RegRipper loads a hive and formats large amounts of data for easier analysis. Zimmerman Tools contains multiple utilities in one zipped folder.
Using gkape.exe in KAPE, collect the mounted data to create a triage collection:
- Target source:
E:\ - Target destination:
C:\Cases
Check: KapeTriage, Deduplicate, Container = None → press OK.
You can store data in a container, but it is not required. On the right side, KAPE has Use module options allowing you to select tools and run them against targets — helpful when you know what to look for. Check the Cases folder — the triage collection should be there.
Registry Explorer (Zimmerman Tools)
A deep dive on Windows Registry and user discovery (who executed which executable?) can be explored through Registry Explorer. It collects data from HKEY_USERS and other symbolic links. Windows security maps to HKEY_LOCAL_MACHINE, which holds the registry keys — the files to analyze.
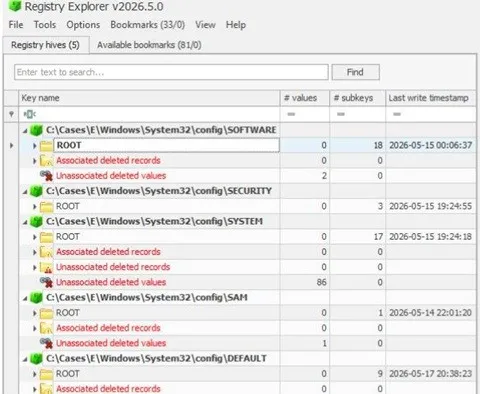
Registry Explorer shows registry hives located at:
Cases/E/Windows/System32/Config
To look at deleted values, check the Bookmarks page:
These can be explored further. For example, in Bookmarks:
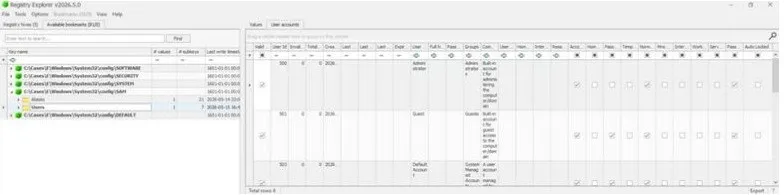
C:\Cases\E\Windows\System32\Config\SAM\Users
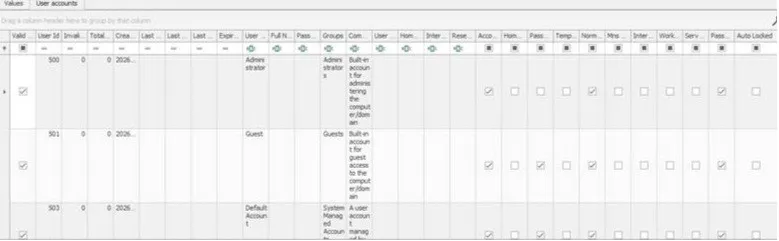
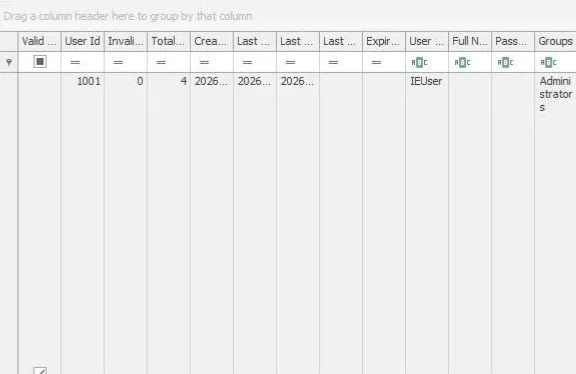
Each entry contains a user ID, date created, and user group. An analyst would examine the SIDs here:
- SID 500 — Administrator group (admin privileges)
- SID 1000 — Default user group
Reference: TCM Security / BlueCapeSecurity (@bluecapesec)