This article dives into how to analyze data on a compromised system — a malicious script called AtomicService was run on a Windows 10 VM acting as the target — and what to look for. The Forensic Process has four phases: Collection, Examination, Analysis, Reporting. This covers the Analysis and Reporting phases.
This is an analysis of the data collected in the Memory Acquisition article.
Analysis
Tool needed: RegRipper rip.exe
This executable shows the network list — networks connected to during the attack within a specific timeframe.
rip.exe
Lists all available plugin options.
rip.exe -r file_location -p plugin
Basic command structure. file_location is a registry key (e.g. SAM, SOFTWARE). plugin is the specific plugin to run.
Network Analysis
- Run plugin:
nic2 - Look in Registry Explorer for useful info:
Registry Location: HKLM\System\CurrentControlSet\Services\Tcpip\Parameters\Interfaces\{interface-name}
| Key | Value |
|---|---|
| DhcpIPAddress | 10.0.2.15 |
| DhcpSubnetMask | 255.255.255.0 |
| DhcpServer | 10.0.2.2 |
| DhcpNameServer | 192.168.1.1 |
| DhcpDefaultGateway | 10.0.2.2 |
| DhcpSubnetMaskOpt | 255.255.255.0 |
Other Useful Plugins
1. shutdown
Shutdown time at: HKLM\System\ControlSet001\Control\Windows\ShutdownTime
Defender settings — LastWrite Time: 2026-05-15 00:06:52Z at HKLM\Software\Microsoft\Windows Defender\
2. defender — shows the last time something was written to a Defender key
- Key path:
Microsoft\Windows Defender\Real-Time Protection - LastWrite Time:
2026-05-15 00:06:52Z DisableRealtimeMonitoringvalue =0
Note: Microsoft Defender does not require a Windows Defender key in modern versions.
3. networklist — shows active networks during an attack (e.g. if an attacker connected through a cafe’s Wi-Fi).
Batch Data Collection
After analysis, use a for loop to write all registry data to text files:
for /r %i in (*) do (C:\Tools\RegRipper3.0-master\RegRipper3.0-master\rip.exe -r %i -a > %i.txt)
To unhide registry keys so RegRipper picks them up:
attrib -h hiddenfilename
Registry hive .txt files hold useful information. For example, profilelist in SOFTWARE.txt shows profiles created.
Profiles vs. Users: Profiles interact with the GUI — they require someone physically at a machine or connecting remotely. Timestamps show when a profile was last written to.
A way to check an attacker’s last action is through Windows Explorer — it remembers the last files opened.
User Analysis
For every command in a terminal using Zimmerman Tools, navigate into the folder containing the unzipped Zimmerman Tools first.
Tools:
- Registry Explorer — parses registry keys (
NTUSER.DAT) for UserAssist and RecentDocs - ShellBagsExplorer — part of Zimmerman Tools
| Artifact | What it shows |
|---|---|
| UserAssist | Applications opened = proof of execution |
| RecentDocs | Files and folders opened, logs + timestamps |
| Shellbags | Locations browsed, path, and timestamp of access by user/attacker |
| Open / Save MRU | Files opened (BagMRU stores folder access) |
| Last-Visited MRU | Applications used to open files |
Suppose an attacker accesses a folder then deletes it — how does a forensic analyst observe their actions? Shellbags. Shellbags can log access to a folder even after that folder no longer exists. ShellBagsExplorer loads an offline hive of shellbags and documents the MRU (timestamp) and resource (path to what was accessed).
Download: ericzimmerman.github.io
NTFS and MFT Analysis — How to Find Evidence of Deleted Files
NTFS is the Windows default file system. The MFT (Master File Table) has a record header, $STD_INFO, $FILE_NAME, and $DATA. The record header holds “not in use” data to be deleted. The standard info attribute contains timestamps.
The first entry (entry 0) is the MFT itself:
MFTECmd.exe -f C:\Cases\E\$MFT --de 0
To see MFT data, pass 0. After -f, put the file path where $MFT lives.
MFTECmd.exe -f C:\Cases\E\$MFT --csv C:\Cases\Analysis\NFTs --csvf MFT.csv
Saves MFT data to a CSV file. The second path is where you want to store the data.
Note:
--is two dashes.
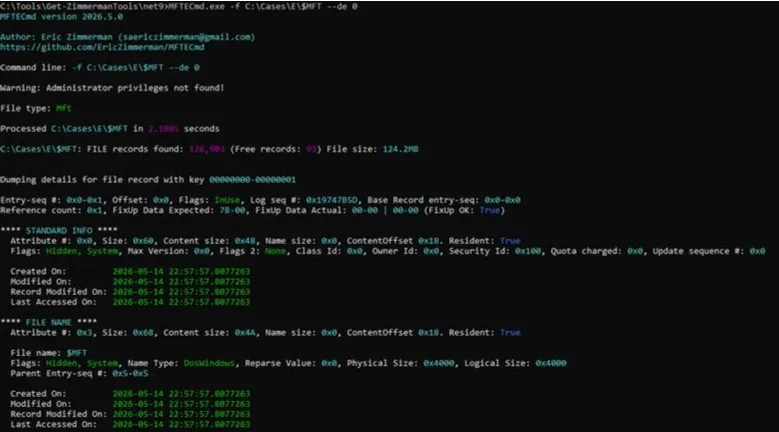
If a flag shows not InUse, the file is deleted — but there is still a record of it in the MFT. In this case the flag is InUse.
Standard Info timestamps:
| Timestamp | Value |
|---|---|
| Created On | 2026-05-15 00:07:18 |
| Modified On | 2026-05-15 00:07:18 |
| Record Modified On | 2026-05-15 00:07:18 |
| Last Accessed On | 2026-05-15 16:46:04 |
FN (File Name) timestamps:
| Timestamp | Value |
|---|---|
| Created On | 2026-05-15 00:07:18 |
| Modified On | 2026-05-15 00:07:18 |
| Record Modified On | 2026-05-15 00:07:18 |
| Last Accessed On | 2026-05-15 00:07:18 |
Data and BITMAP Attribute:
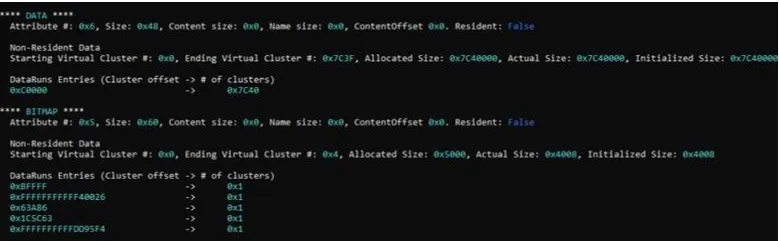
Data resident is false, meaning the data is stored at another location. The cluster pointer 0x7C40 holds the rest of the MFT data. If a residence fails or a file is deleted, it may be found at the pointer location.
Use Timeline Explorer (TimelineExplorer.exe in Zimmerman Tools) and drag the CSV into it. Created0x10 is the Standard Attribute; Created0x30 is the File attribute. This tool surfaces entry numbers, timestamps, and more.
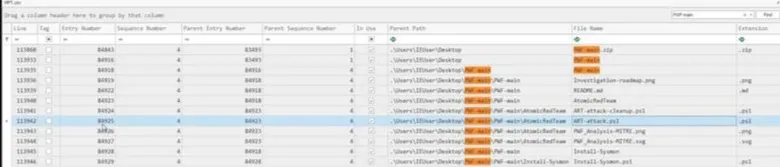
A forensic analyst can find evidence of an attack script and when it was run using the entry number:
MFTECmd.exe -f C:\Cases\E\$MFT --de entrynumber
If the header shows Flags: IsFree, the file can be overwritten. The data attribute section may contain a pointer to a cluster (unallocated space) showing the location of data that no longer exists in the MFT. File carving would be the next step — carving data out of that unallocated space.
Execution Artifacts — Build a Timeline of Executions
Loading the System hive into Registry Explorer surfaces the BAM (Background Activity Monitor) contents. BAM shows what programs ran during the attack and lists the executables found. Note that BAM does not hold all executables — some may be erased on restart. If the system was shut down, data will be in the ShimCache. The Bookmarks section has a BAM and AppCompatCache subfolder. The same information can also be found in SYSTEM.txt.
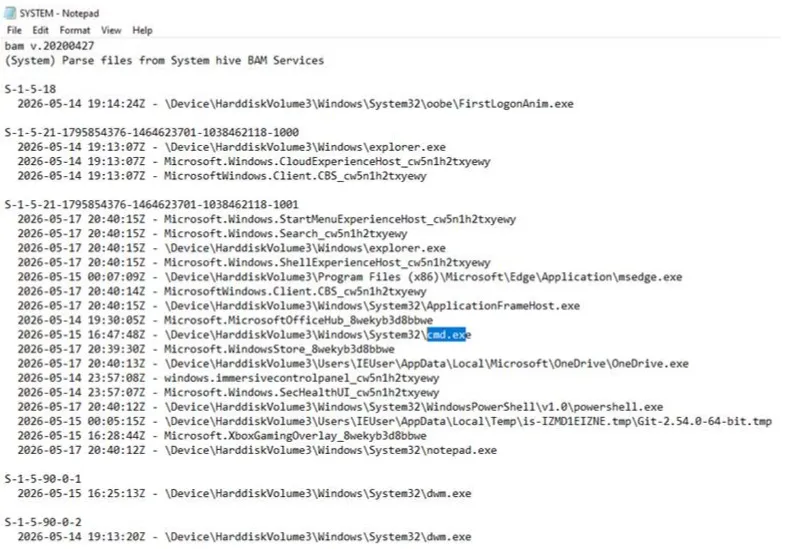
Cmd.exe with admin status is a suspicious executable worth investigating. When a malware exploit occurs, it can execute scripts and download payloads. AppCompatCache is another artifact that can show proof of malicious .exe executables. Zimmerman Tools includes AppCompatCacheParser for ShimCache analysis.
Be in the Zimmerman Tools folder in the cmd terminal before running:
AppCompatCacheParser.exe -f C:\Cases\Analysis\Registry\SYSTEM --csv C:\Cases\Analysis\Execution
The first path is where the SYSTEM hive is stored. The second path is where the timeline CSV will be saved — open it in Timeline Explorer.
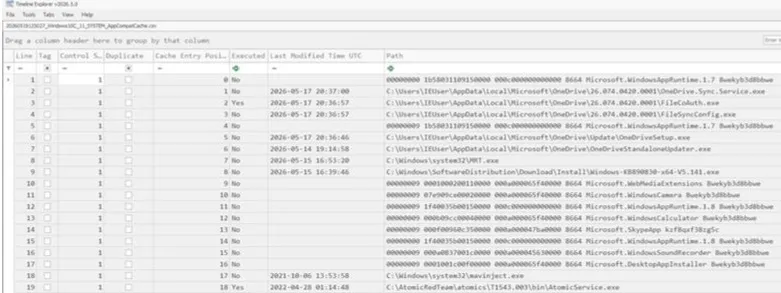
The Execution section shows whether each .exe was actually run, its cache entry position, and proof of execution. Key entries:
| Executable | Cache Position |
|---|---|
AtomicService.exe | 19 |
mavinject.exe | 18 — common vehicle for injecting malicious code |
The AmCache stores information about executables, installers, drivers, shortcuts, and more. Registry Explorer can parse the AmCache hive, or use AmCacheParser in Zimmerman Tools:
Location: C:\Cases\E\Windows\AppCompat\Programs\Amcache.hve
AmCacheParser.exe -f C:\Cases\E\Windows\AppCompat\Programs\Amcache.hve --csv C:\Cases\Analysis\Execution
Parses the hive and saves the CSV to the Execution folder. Drag all resulting CSVs into Timeline Explorer. The SHA-1 column shows the hash for each executable — compare against published threat intelligence to identify known malware. Even if the malware no longer exists on disk, it can be identified here.
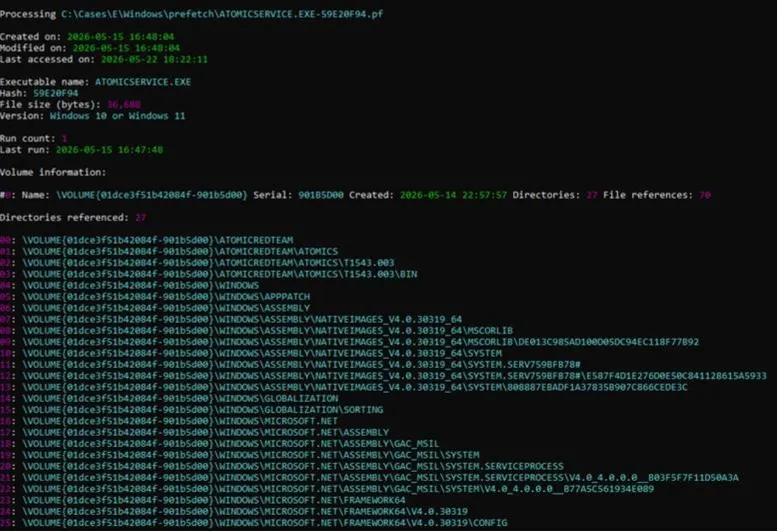
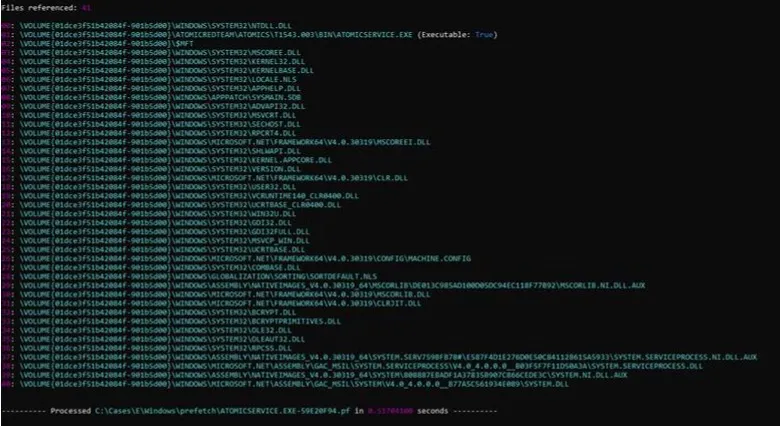
If Prefetch is enabled: Two entries of the same malware with different hashes indicate it may exist in multiple locations. To check, load the SYSTEM hive in Registry Explorer, navigate to PrefetchParameters, and look for EnablePrefetcher. If the value is 3, Prefetch is enabled. Use PECmd.exe to see how many times a file ran and which directories it referenced:
PECmd.exe -f C:\Cases\E\Windows\prefetch\ATOMICSERVICE.EXE-CFFBD82A.pf
Parse all .pf files and save to CSV:
PECmd.exe -d C:\Cases\E\Windows\prefetch --csv C:\Cases\Analysis\Execution\
Load the output CSV into Timeline Explorer — it shows each executable run, run count, hash, and timestamps. Key executables to look for:
POWERSHELL.execmd.exeNET.exeREG.exeSCHTASKS.exeSC.exeATOMICSERVICE.EXEMAVINJECT.exeNOTEPAD.exe
Autorun keys are locations where malicious actors plant persistent scripts. Use Registry Explorer or RegRipper to find these. Common persistence registry keys:
HKEY_CURRENT_USER\Software\Microsoft\Windows\CurrentVersion\Run
HKEY_CURRENT_USER\Software\Microsoft\Windows\CurrentVersion\RunOnce
HKEY_LOCAL_MACHINE\Software\Microsoft\Windows\CurrentVersion\Run
HKEY_LOCAL_MACHINE\Software\Microsoft\Windows\CurrentVersion\RunOnce
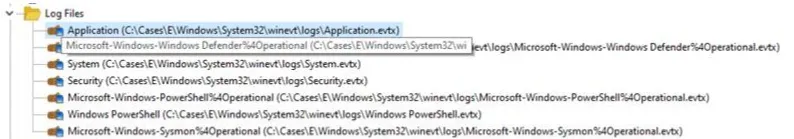
Event Log Analysis
Analyze logs with Event Log Explorer: eventlogxp.com
Drag C:\Cases\E\Windows\System32\winevt\logs\Application.evtx into Event Log Explorer, or use EvtxECmd in Zimmerman Tools:
EvtxECmd.exe -d C:\Cases\E\Windows\System32\winevt\logs --csv C:\Cases\Analysis\EventLogs
Parses all logs and saves them as CSV in the EventLogs folder. You can also use --maps to parse logs with additional context.
Load the CSV into Timeline Explorer to surface event IDs, creation times, process IDs, and more. Industry timestamp format for Excel: YYYY-MM-DD HH:MM:SS.
Key Event IDs to investigate:
| Event ID | Meaning |
|---|---|
| 5000 | Microsoft Defender enabled |
| 5001 | Microsoft Defender disabled — attacker may have turned this off to bypass alerts |
| 7045 | Service installed — indicates potentially malicious services |
| 4624 | Successful account logon — attacker may need these privileges to download malware |
| 400 | PowerShell started — can deploy ransomware in a single line; executes payloads without downloading files |
| 4104 / 4103 | Captures the full script/payload executed by PowerShell |
Common Logon types to flag: Type 3 (Network) and Type 10 (Remote) — users must initiate these.
Application.evtx
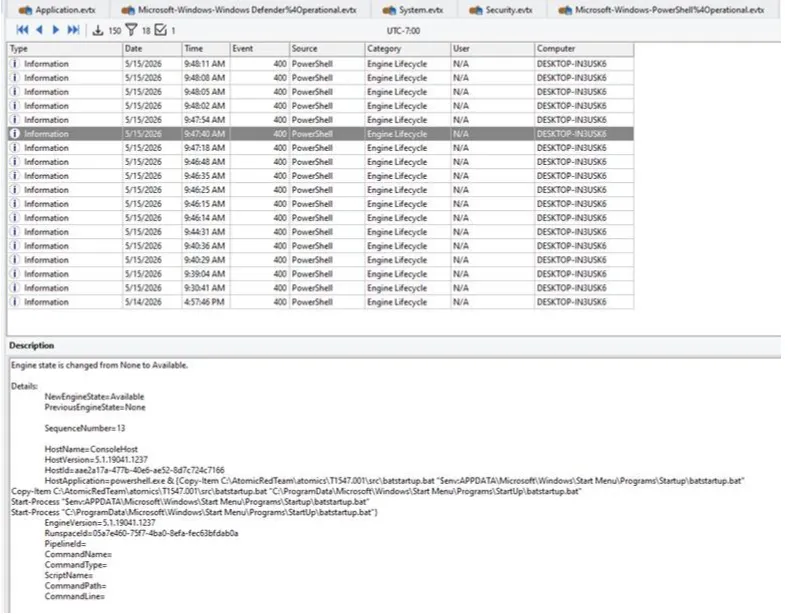
Example of a malicious PowerShell log
Sysmon logs capture process creation, memory access, and DNS queries. Load the Sysmon log into Event Log Explorer:
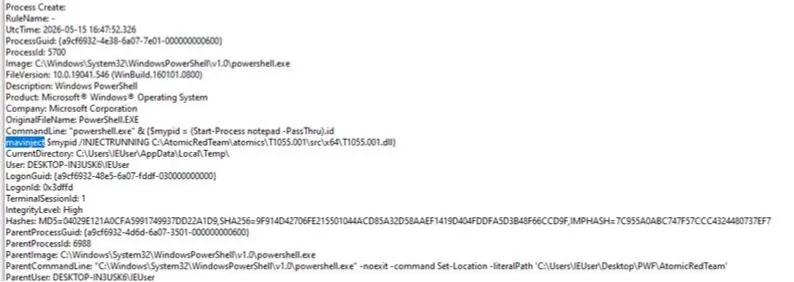
Malicious payload = mavinject
Further investigation into the process ID may reveal a backdoor — monitor for the same process ID in future scans.
Reporting
Before writing, establish priorities:
- Who is the target audience and what are they looking for?
- What level of technical detail is expected?
Rules:
- Be unbiased
- Represent the facts, not your opinions
- Investigate every option — something may look malicious but have a legitimate explanation; rule out other causes before drawing conclusions
End with:
- What are the next steps after obtaining this information?
- How does the team move into the Incident Response phase?
Common Report Types
1. Forensic Report Evidence-heavy, detail-oriented, technical writing — used in legal cases. A breakdown of each piece of evidence mapped back to specific artifacts (registry keys, MFT entries, event logs).
2. High-Level Debrief Answers questions a team asks after an incident. Business impact, root cause, and prevention steps — typically presented to a CISO.
3. System Timeline (Super Timeline) What happened and when — tells the story of lateral movement. Pulls events from MACB timestamps, Windows Event Logs, registry hives, and network logs. Shows correlation between action and reaction:
13:53:58— Maliciousmavinject.exeruns →14:21:33— PowerShell connects to external IP
4. Enterprise Environment Report Scope-heavy. Which network segments were affected and how should the network be contained and secured? Covers infrastructure-wide impact, environment concerns (“Did the malware spread? Is the AD domain controller compromised?”), SIEM dashboards, EDR alerts, and firewall rules showing unauthorized configuration changes.
Reference: TCM Security / BlueCapeSecurity (@bluecapesec)